User Tools
users:danyyl:dijet:20180702
This is an old revision of the document!
Fitting strategy for service work
Introduction
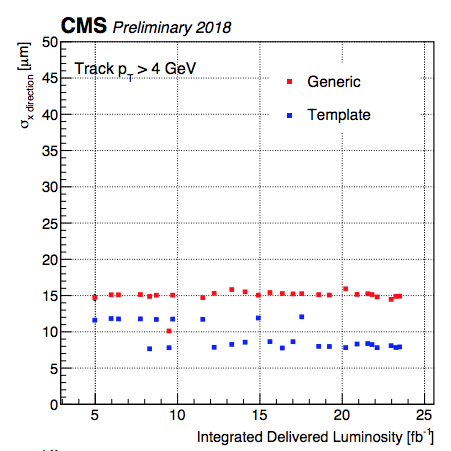
The following history plot from Giorgia shows a weird discrapancy in sigma. So, lower sigma corresponds to the fit with student-t + gaussian function and higher sigmas to double student-t function.
users/danyyl/dijet/20180702.1532685392.txt.gz · Last modified: by dbrzhech

