User Tools
Fitting strategy for service work
Introduction
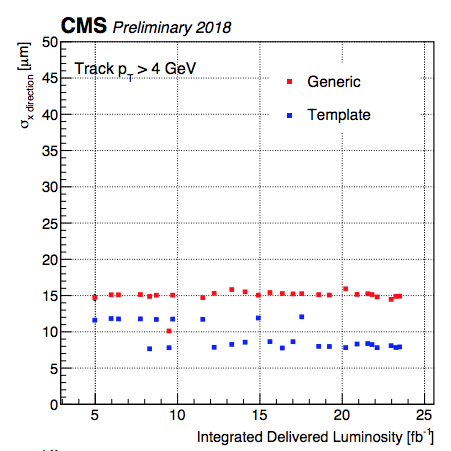
The following history plot from Giorgia shows a weird discrapancy in sigma. So, higher sigmas corresponds to the fit with student-t + gaussian function and lower sigmas to double student-t function.
 I'm starting to investigate this and meanwhile improve my fitting strategy.
I found out that the residual distribution has really weird shape. One can see on the following plot, that there is a triple-peak structure in the central region.
I'm starting to investigate this and meanwhile improve my fitting strategy.
I found out that the residual distribution has really weird shape. One can see on the following plot, that there is a triple-peak structure in the central region.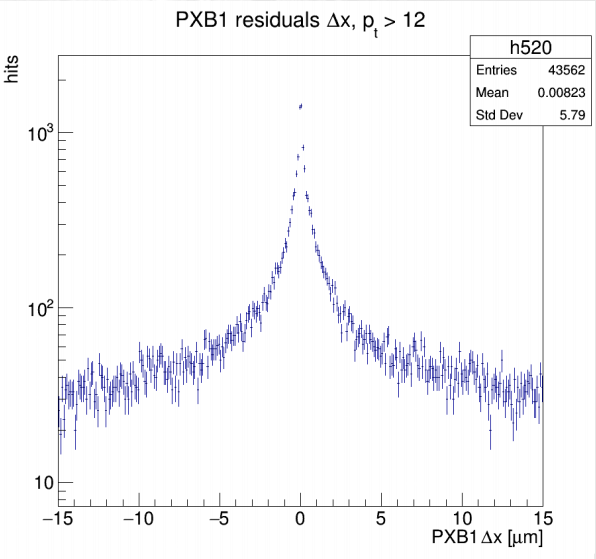 After that I started to work on the fit function. Also, we asked Giorgia(Camilla, Stefanos and me) to check if she has the same structure.
Dijet+ISR
I was trying to find and fix the bug in the code corresponding generation step for the bias studies. I didn't find any software issue, so start to debug it (in a simple way with print outs after suspicious lines).
