User Tools
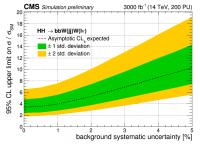
limits:brazilianplotexample
To be used with CMS_lumi.py and tdrstyle.py for the CMS plot style:
- BrazilianPlots.py
import ROOT
from ROOT import TFile, TTree, TCanvas, TGraph, TMultiGraph, TGraphErrors, TLegend
import CMS_lumi, tdrstyle
import subprocess # to execute shell command
ROOT.gROOT.SetBatch(ROOT.kTRUE)

# CMS style
CMS_lumi.cmsText = "CMS"
CMS_lumi.extraText = "Preliminary"
CMS_lumi.cmsTextSize = 0.65
CMS_lumi.outOfFrame = True
tdrstyle.setTDRStyle()


# CREATE datacards
def createDataCardsThetaB(labels,values):

    datacard_lines = [ "# automatic generated counting experiment",
                       "imax 1  number of channels",
                       "jmax 1  number of backgrounds",
                       "kmax 2  number of nuisance parameters (sources of systematical uncertainties)",
                       "------------",
                       "bin 1",
                       "observation 0",
                       "------------",
                       "bin              1     1    ",
                       "process         HH   ttbar  ",
                       "process          0     1    ",
                       "rate            107  52861  ",
                       "------------",
                       #"lumi    lnN    1.10  1.10   luminosity",
                       "xs_HH   lnN    1.02    -    cross section + signal efficiency + other minor ones",
                       #"ttbar   lnN      -   1.02   ",
                      ]

    # make datacards for differents values of theta_B
    for label, theta_B in zip(labels,values):
        datacard = open("datacard_"+label+".txt", 'w')
        for line in datacard_lines:
            datacard.write(line+"\n")
        theta_B_formatted = ("%.3f" % (1+theta_B/100)).rstrip('0').rstrip('.') # format
        datacard.write("ttbar   lnN      -   %s   " % theta_B_formatted)
        datacard.close()
        print ">>>   datacard_"+label+".txt created"

    return labels


# EXECUTE datacards
def executeDataCards(labels):

    for label in labels:
        file_name = "datacard_"+label+".txt"
        combine_command = "combine -M Asymptotic -m 125 -n %s %s" % (label,file_name)
        print ""
        print ">>> " + combine_command
        p = subprocess.Popen(combine_command, shell=True, stdout=subprocess.PIPE, stderr=subprocess.STDOUT)
        for line in p.stdout.readlines():
            print line.rstrip("\n")
        print ">>>   higgsCombine"+label+".Asymptotic.mH125.root created"
        retval = p.wait()


# GET limits from root file
def getLimits(file_name):

    file = TFile(file_name)
    tree = file.Get("limit")

    limits = [ ]
    for quantile in tree:
        limits.append(tree.limit)
        print ">>>   %.2f" % limits[-1]

    return limits[:6]


# PLOT upper limits
def plotUpperLimits(labels,values):
    # see CMS plot guidelines: https://ghm.web.cern.ch/ghm/plots/

    N = len(labels)
    yellow = TGraph(2*N)    # yellow band
    green = TGraph(2*N)     # green band
    median = TGraph(N)      # median line

    up2s = [ ]
    for i in range(N):
        file_name = "higgsCombine"+labels[i]+"Asymptotic.mH125.root"
        limit = getLimits(file_name)
        up2s.append(limit[4])
        yellow.SetPoint(    i,    values[i], limit[4] ) # + 2 sigma
        green.SetPoint(     i,    values[i], limit[3] ) # + 1 sigma
        median.SetPoint(    i,    values[i], limit[2] ) # median
        green.SetPoint(  2*N-1-i, values[i], limit[1] ) # - 1 sigma
        yellow.SetPoint( 2*N-1-i, values[i], limit[0] ) # - 2 sigma

    W = 800
    H  = 600
    T = 0.08*H
    B = 0.12*H
    L = 0.12*W
    R = 0.04*W
    c = TCanvas("c","c",100,100,W,H)
    c.SetFillColor(0)
    c.SetBorderMode(0)
    c.SetFrameFillStyle(0)
    c.SetFrameBorderMode(0)
    c.SetLeftMargin( L/W )
    c.SetRightMargin( R/W )
    c.SetTopMargin( T/H )
    c.SetBottomMargin( B/H )
    c.SetTickx(0)
    c.SetTicky(0)
    c.SetGrid()
    c.cd()
    frame = c.DrawFrame(1.4,0.001, 4.1, 10)
    frame.GetYaxis().CenterTitle()
    frame.GetYaxis().SetTitleSize(0.05)
    frame.GetXaxis().SetTitleSize(0.05)
    frame.GetXaxis().SetLabelSize(0.04)
    frame.GetYaxis().SetLabelSize(0.04)
    frame.GetYaxis().SetTitleOffset(0.9)
    frame.GetXaxis().SetNdivisions(508)
    frame.GetYaxis().CenterTitle(True)
    frame.GetYaxis().SetTitle("95% upper limit on #sigma / #sigma_{SM}")
#    frame.GetYaxis().SetTitle("95% upper limit on #sigma #times BR / (#sigma #times BR)_{SM}")
    frame.GetXaxis().SetTitle("background systematic uncertainty [%]")
    frame.SetMinimum(0)
    frame.SetMaximum(max(up2s)*1.05)
    frame.GetXaxis().SetLimits(min(values),max(values))

    yellow.SetFillColor(ROOT.kOrange)
    yellow.SetLineColor(ROOT.kOrange)
    yellow.SetFillStyle(1001)
    yellow.Draw('F')

    green.SetFillColor(ROOT.kGreen+1)
    green.SetLineColor(ROOT.kGreen+1)
    green.SetFillStyle(1001)
    green.Draw('Fsame')

    median.SetLineColor(1)
    median.SetLineWidth(2)
    median.SetLineStyle(2)
    median.Draw('Lsame')

    CMS_lumi.CMS_lumi(c,14,11)
    ROOT.gPad.SetTicks(1,1)
    frame.Draw('sameaxis')

    x1 = 0.15
    x2 = x1 + 0.24
    y2 = 0.76
    y1 = 0.60
    legend = TLegend(x1,y1,x2,y2)
    legend.SetFillStyle(0)
    legend.SetBorderSize(0)
    legend.SetTextSize(0.041)
    legend.SetTextFont(42)
    legend.AddEntry(median, "Asymptotic CL_{s} expected",'L')
    legend.AddEntry(green, "#pm 1 std. deviation",'f')
#    legend.AddEntry(green, "Asymptotic CL_{s} #pm 1 std. deviation",'f')
    legend.AddEntry(yellow,"#pm 2 std. deviation",'f')
#    legend.AddEntry(green, "Asymptotic CL_{s} #pm 2 std. deviation",'f')
    legend.Draw()

    print " "
    c.SaveAs("UpperLimit.png")
    c.Close()


# RANGE of floats
def frange(start, stop, step):
    i = start
    while i <= stop:
        yield i
        i += step


# MAIN
def main():

    labels = [ ]
    values = [ ]
    for theta_B in frange(0.0,5.0,1):
        values.append(theta_B)
        label = "%d" % (theta_B*10)
        labels.append(label)

    createDataCardsThetaB(labels,values)
    executeDataCards(labels)
    plotUpperLimits(labels,values)


if __name__ == '__main__':
    main()
limits/brazilianplotexample.txt · Last modified: by iwn


