Table of Contents
UZH laser Transient Current Technique (TCT) setup
Introduction
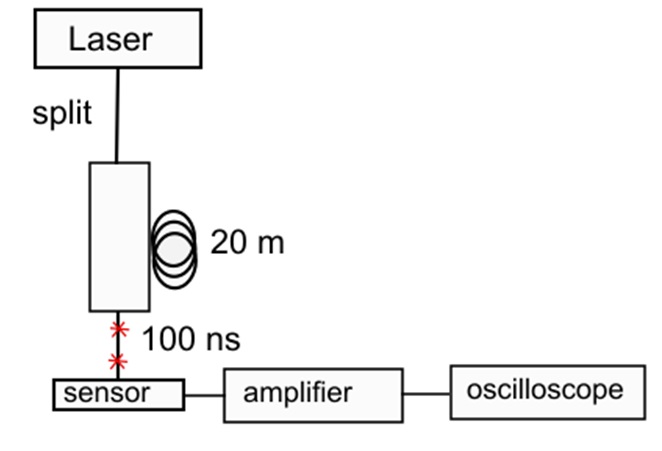
This page aims to thoroughly describe the TCT setup used at the physics department of UZH. It starts by introducing the setup, the hardware and connections, and the software to run the tests. The pulsed infrared laser used in TCT (1064nm wavelength) passes through an optic fiber which splits in two section where one is 20m longer than the other. This leads to having two similar pulses with a time difference of 100nm. The beam then is applied on a sensor, with an amplifier and an oscilloscope.
Setup
The setup is mounted within an aluminum Faraday cage for E/M shielding with frontal access though a parallel opening door. The test sensor is installed on a X-Y movable plate underneath the laser. The laser lens can be moved in the z-axis for focal point alignment. The travel range of the stages is of 10cm*10cm*10cm with a resolution of 1 micron. The following table lists the various equipment used in the UZH setup.
| Device | Description | Interface | Hostname | Username | Password | IP Address |
|---|---|---|---|---|---|---|
| Control PC | Advantech MIC-770 | USB/LAN | tct-computer.physik.uzh.ch | tct | TCT2021setup | 10.65.117.46 |
| Oscilloscope | LeCroy WaveRunner 9254M | LAN | oscilloscope7.physik.uzh.ch | LeCroyUser | lecroyservice | 10.65.234.147(inner) 130.60.164.147 (outer) |
| LCRYADMIN | SCOPEADMIN | |||||
| Low voltage power supply | Rohde & Schwarz HMP4040 | LAN | ||||
| High voltage power supply | CAEN DT1419ET | LAN | ||||
| Digitizer | CAEN DT5742B 16-channel Digitizer | USB | N/A | |||
| 1060nm, 100mW laser | Particulars LA-01 IR FC | USB | N/A | |||
| Beam expander | Thorlabs GBE15-B | N/A | N/A | |||
| Z-axis stage | Standa 8SMC5-USB-B8-1 | USB | N/A | |||
| X-Y axis stage | Standa 8SMC5-USB-B9-2 | USB | N/A | |||
The TCT computer has a public key used to access the distributed storage for data migration. The key is located at /home/tct/.ssh/ at the file TCTSetup_uzh.pub. The generic account associated withe the setup at the uzh cluster is tctsetup@linux.physik.uzh.ch coupled with centrally manged storage at /disk/data7/tctsetup. Data are backed up one per week. Connection is performed without the use of the password since the public key is already in the server authorization table and the connection parameters have been setup at the ssh configuration file. The connection is named UZHServer. From a bash command prompt one can simply type: ssh UZHServer
The allocated storage at /disk/data7/tctsetup is automatically mounted at startup to the TCT_setup computer at /home/tct/UZHServerData via SSHFS. The location can be accessed as any other folder in the system and data taking scripts should be set to save data to that location be default.
To copy pre-existing data to the server please use: rsync -avh –progress <current data folder> /home/tct/UZHServerData This will endure recursive directory copy and will validate files while displaying progress of the operation.
The optics used in the UZH setup and their specifications can be found in the following table.
| Part | Manufacturer | Model | Link(s) |
|---|---|---|---|
| Laser | Particulars | LA-01 IR FC | Product, Operation, Manual |
| Thread Adapter | Thorlabs | AD1109F | Product |
| Beam Expander | GBE15-B | Product | |
| Iris Diaphragm | SM2D25D | Product | |
| Motor Controllers | Standa | 8SMC5-USB-B8-1 | Manual |
| Standa 8SMC5-USB-B9-2 |
The following are schematic diagrams of the setup at UZH. The first diagram is the setup used for sensors with 4 channels while the second diagram is the setup used for sensors with 16 channels. The main difference between the two setups is the use of an oscilloscope for the 4 channel setup compared to the use of a digitizer for the 16 channel setup.
4 channel setup:

16 channel setup:

Measurement
Pre-measurement steps
- Use microscope to examine the sensor connections.
- Make a measurement of the distance from one edge to the other using two straight lines.
- Take a picture for future reference. Rename the file to indicate which sensor was examined.
An example of a picture taken using a microscope of a four channel board is as follows:

For sensors mounted in the four channel daughter boards:
- The two rectangular Pads located on either side of the sensor placeholder along the short board dimension correspond to ground.
- The four square pads located at either side of the sensor placeholder correspond to the readout amplifiers.
X-Y Sensor alignment
Every time a new sensor is installed, a rough alignment of the focal spot with respect to the area of interest has to be performed. A more refined alignment can then be achieved during the Z-axis scan (see below). The optical fiber connecting the laser diode to the focusing lens has to be physically removed from the lens assembly (unscrew the connector). A led can then be loosely placed at the lens input, powered by a 5V power supply to idicate the location of the focal spot. Manually adjust the plate using the knobs located underneath (right side) until the light is approximately at the correct location. Remove the LED and reconnect the laser wire.
Focal point calibration (Z-axis alignment)
Before any measurement, a calibration of the optimal z-distance of the laser lens with respect to the sample has to be performed. The nominal distance corresponds tot he focal point of the beam, in winch the waist dimension becomes minimal.
Procedure
- Power the first and second stage amplifiers. For four channel boards, both stages are integrated for all channels on the PCB and an external voltage of 3.1V should be applied. The current sourced by the amplifiers is 230mA, and the compliance current is 250mA.
- Apply bias voltage to the sensor using the high voltage power supply. For CAEN power supplies, polarity is set internally and cannot be adjusted by software. A led in the front panel informs of the selected polarity. The on-off switch actually has three settings, ON (flipped up), OFF (middle) and KILL (flipped down). When turning off the high voltage, do not over-flick the switch from an ON to KILL. One needs to correctly adjust the compliance current before switching on the output of the power supply.
- Activate the laser using the software on the computer and verify using the oscilloscope that a signal can be observed in at least one of the pads when triggering to the laser's trigger.
- Manually locate the four corners by adjusting the position of the sensor using the software. Increasing the position in the positive x-direction shifts the plate towards the right side of the box, and increasing the position in the positive y-direction shifts the plate towards the back of the box. Once at the corner of an active region, the observed waveform amplitude will decrease and totally disappear.
- Once the four corners have been located, shine the laser somewhere in the middle of one of the four quadrants. There is a macro script to run which adjusts the z position (height) of the laser while measuring the voltage. Using this, we can find out the optimum distance the laser should be from the sensor.
- Alternatively, one could run a preview scan once some signals have been detected on the oscilloscope to locate the center of the sensor with greater precision. As shown in the example picture below, which is the preview 2D heat map of the voltage readout from one of the two channels of the daughter board, the position can be determined by hovering the mouse over the center of the slide.


Trigger
Should the need to check the trigger pulse arise, connect the trigger cable to one of the channels of the oscilloscope. Set the trigger to auto, and the following pulse should display on the screen:

Once the trigger pulse has been verified, connect the trigger cable to the “Ext” port of the oscilloscope. Under the trigger settings, ensure that the trigger mode is set to external, edge, negative slope and at a level of -410mV.
Software
There is a script that needs to be running alongside all measurements, “TheSetup.py”, which can be found in the following directory:
code/repos/tct_setup/
To run the script, enter the following command into the terminal:
python3 TheSetup.py
To access the graphical interface of the motors, locate the script “tct_graphic_interface.py” which can be found in the following directory: (Make sure to stop TheSetup.py before running the following as it can cause errors.)
code/repos/PyticularsTCT/gui/
Then, enter the following command into the terminal to run the script:
python3 tct_graphic_interface.py
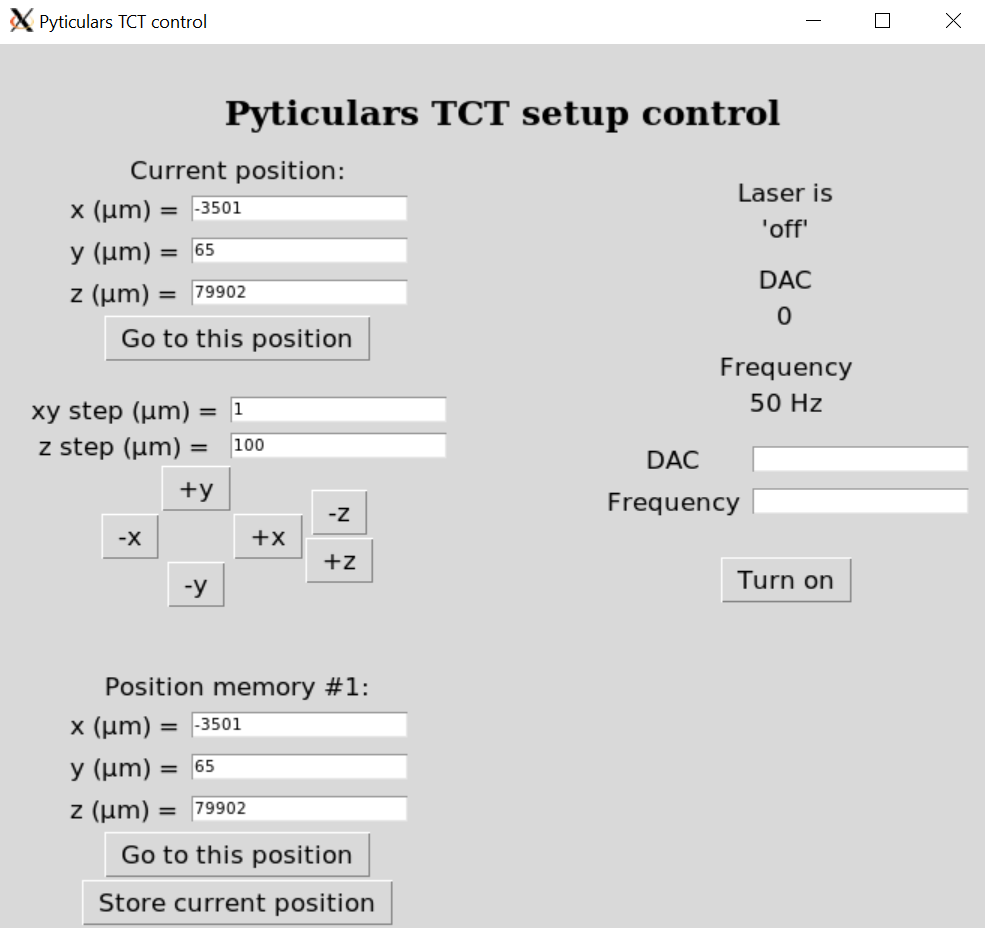
The graphical interface as shown on the right should appear. This graphical interface allows for the user to control the motor plates as well as the laser. The motor plates can be controlled by entering a desired position and clicking the “Go to this position” button. The laser can be turned on and off by clicking the “Turn on” or “Turn off” button. The energy and frequency of the laser can also be controlled via the “DAC” and “Frequency” settings respectively. DAC is a value that can be set between 0 and 1000 which determines the energy of the laser - the higher the DAC value, the higher the energy output of the laser. However, this does not mean that a DAC value of 0 equates to the laser being off. The values are offset, and a DAC value higher than 600 results in the laser disappearing1). As such, users should use a DAC value between 0 and 500. The frequency setting determines how frequent the laser pulses are, and can be set from 50Hz to 1000kHz. To change the DAC or frequency setting, simply enter the desired values and hit the “Enter” key.
Remote Access
The computer used in the UZH setup can be remotely accessed. This allows the user to control the software on the computer without needing to physically be present in the clean room, which can be convenient. In this section, we describe how to do so for a computer running Windows. First, an SSH client which allows the user to open a remote command prompt to the system needs to be installed. This would be the PuTTy software (download). Next, we would need an X-Window server that allows the remote system to forward graphics and windows to our screen. For Windows, this would be the software Xming (download). Finally, to access files remotely in a graphical environment, we would need an SFT/SCP client. The software for this is WinSCP (download).
Computer
Once the above software are installed, create a profile in PuTTy. To do so, open up the software to the following screen:
image here
Under “Host Name”, fill in tct@tct-computer.physik.uzh.ch. Then, from the panel on the right, under “session” → “X11”, enable the X11 forwarding.
Oscilloscope
The tct setup is configured with its' proper internal network structure, with the control computer acting as a router between any internet traffic and devices on the setup network. Instruments attached to the internal network cannot be directly accessed but either via passing though a connection to the tct computer or via a tunnel.
Once an ssh connection to the tct computer is established, one can connect to the oscilloscope gui using the remote desktop protocol by:
rdesktop 192.168.1.5 -u LeCroyUser
Troubleshooting
This section outlines some of the issues we have faced, as well as how we fixed the issue. These issues are documented in this section in hopes that should similar issues arise in the future, they can be identified and resolved quickly.
VI_ERROR_RSRC_NFOUND (-1073807343): Insufficient location information or the requested device or resource is not present in the system.
The line used to connect to the oscilloscope is the following:
self._LeCroy = TeledyneLeCroyPy.LeCroyWaveRunner('USB0::0x05ff::0x1023::2810N60091::INSTR')
If this error is seen, it is likely due to the device not being detected by the computer. This could be due to an incorrect syntax, for example an incorrect USB address, or a missing colon.
RuntimeError: The instrument responded with error: errc.
Useful article. When trying to run “TheSetup.py”, we ran into the above error when trying to connect to the CAEN high voltage power supply. This occurs because of the following line used in the script to connect to the power supply:
caen_power_supply = CAENDesktopHighVoltagePowerSupply(port='/dev/ttyACM3')
This means that the script is trying to connect to the HV power supply by writing to and reading from the file “ttyACM3”. However, this port assignment changes every time the USB connection is plugged into a different port, or even if the computer is restarted! To fix this problem, we have to locate the correct file that the HV power supply is communicating with. To do so, one can write a small script and test every device file found in the directory.
NaN output from the oscilloscope
During a scan, if NaN values are recorded, it could be due to an inappropriate vertical scale of the oscilloscope. This occurs when the vertical scale is too small and the signal is too large, resulting in the signal going out of bounds. To fix the issue, simply increase the volt/div scale.
Execution failed on sql, no such table: dataframe_table
Put the oscilloscope communication protocol to VXI11 instead of TCPIP.