User Tools
latex:tikz:statistics
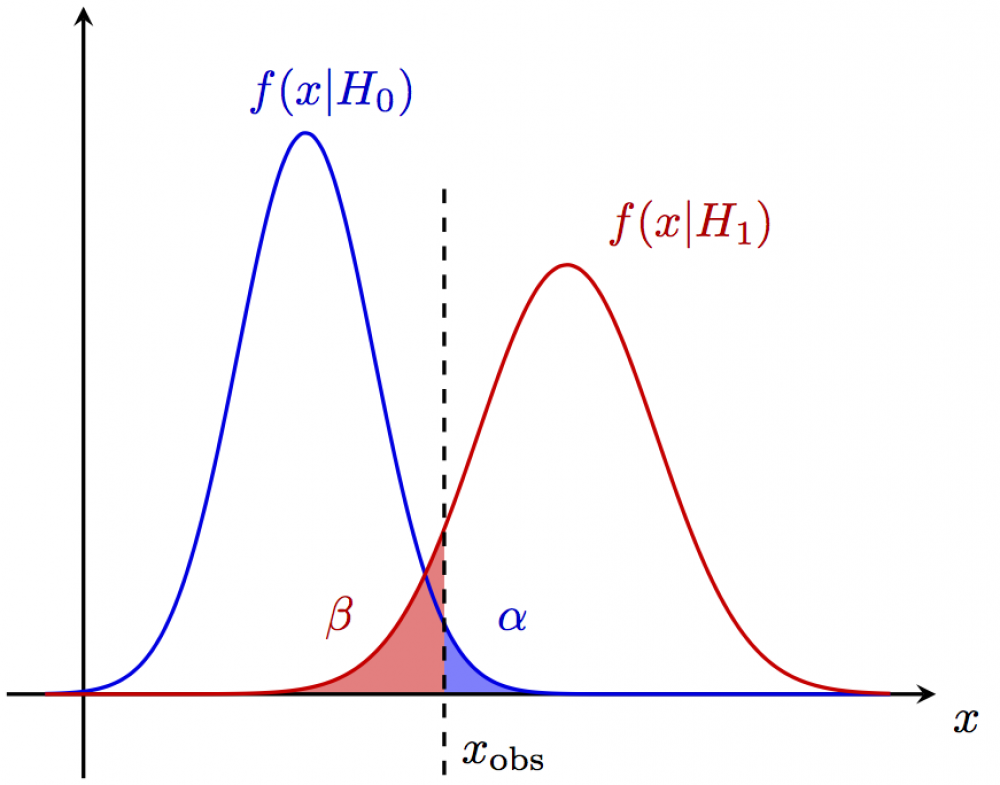
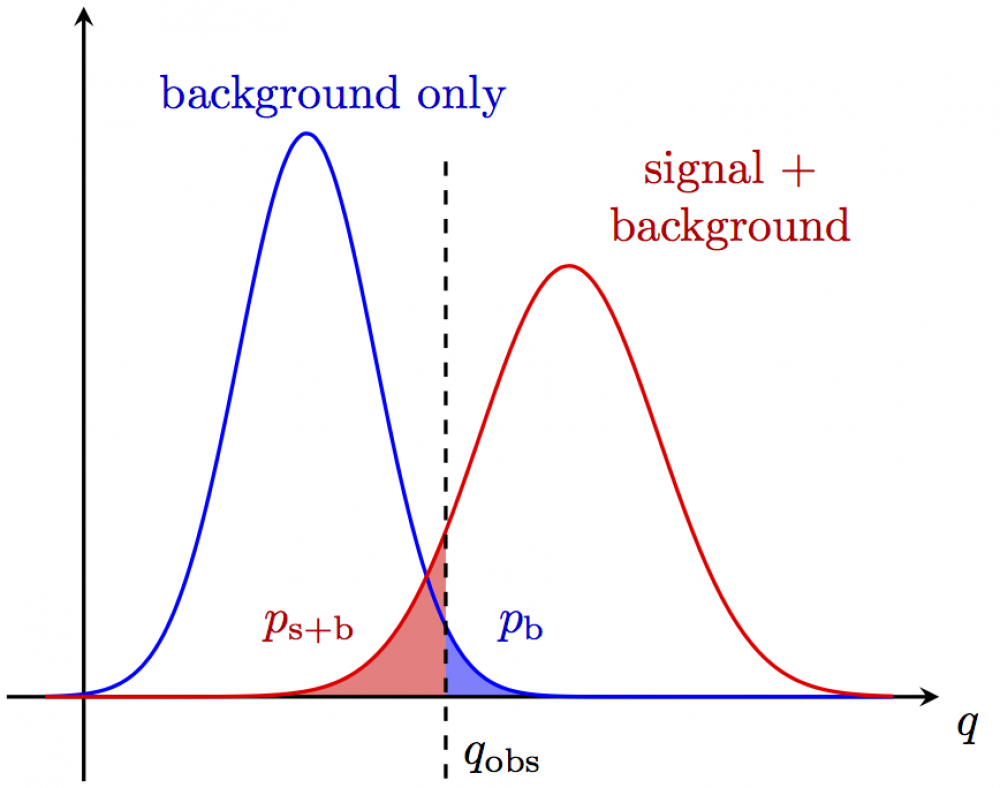
Example of plotting functions, with shaded areas and predefining own functions.
- statistics.tex
% Author: Izaak Neutelings (August, 2017)

\documentclass{article} %[dvipsnames]
\usepackage{amsmath} % for \dfrac
\usepackage{tikz}
\tikzset{>=latex} % for LaTeX arrow head
\usepackage{pgfplots} % for the axis environment
\usepackage{xcolor}

% split figures into pages
\usepackage[active,tightpage]{preview}
\PreviewEnvironment{tikzpicture}
\setlength\PreviewBorder{1pt}%

% define gaussian
\pgfmathdeclarefunction{gauss}{3}{%
  \pgfmathparse{1/(#3*sqrt(2*pi))*exp(-((#1-#2)^2)/(2*#3^2))}%
}

% to fill an area under function
\usepgfplotslibrary{fillbetween}
%\usetikzlibrary{patterns} % for patterns
\pgfplotsset{compat=1.12} % TikZ coordinates <-> axes coordinates
% https://tex.stackexchange.com/questions/240642/add-vertical-line-of-equation-x-2-and-shade-a-region-in-graph-by-pgfplots

% plot aspect ratio
%\def\axisdefaultwidth{8cm}
%\def\axisdefaultheight{6cm}

\begin{document}


% GAUSSIANs: confidence level
\begin{tikzpicture}

  \def\q{13.8};
  \def\B{8.5};
  \def\S{18.5};
  \def\Bs{2.60};
  \def\Ss{3.40};
  \def\xmax{\S+3.2*\Ss};
  \def\ymin{{-0.15*gauss(\B,\B,\Bs)}};

  \begin{axis}[every axis plot post/.append style={
               mark=none,domain={-0.05*(\xmax)}:{1.08*\xmax},samples=80,smooth},
               xmin={-0.1*(\xmax)}, xmax=\xmax,
               ymin=\ymin, ymax={1.1*gauss(\B,\B,\Bs)},
               axis lines=middle,
               axis line style=thick,
               %axis x line=bottom,  % no box around the plot, only x and y axis
               %axis y line=left,    % ...line*=... suppresses the arrow tips
               enlargelimits=upper, % extend the axes a bit to the right and top
               ticks=none,
               xlabel=$x$,
               every axis x label/.style={at={(current axis.right of origin)},anchor=north west},
              ]

    % plots
    \addplot[name path=B,thick,black!10!blue] {gauss(x,\B,\Bs)};
    \addplot[name path=S,thick,black!10!red ] {gauss(x,\S,\Ss)};
    \addplot[black,dashed,name path=Q,thick]
      coordinates {(\q, {0.90*gauss(\B,\B,\Bs)}) (\q, \ymin)}
      node[below=2pt,anchor=south west] {$x_\text{obs}$};

    % fill
    \path[name path=xaxis]
      (0,0) -- (\xmax,0); % \pgfkeysvalueof{/pgfplots/xmin}
    \addplot[white!50!blue] fill between[of=xaxis and B, soft clip={domain=\q:\xmax}];
    \addplot[white!50!red]  fill between[of=xaxis and S, soft clip={domain=0:\q}];

    % labels
    \node[above,      black!20!blue] at (1.12*\B,{gauss(\B,\B,\Bs)}) {$f(x|H_0)$};
    \node[above right,black!20!red ] at (1.05*\S,{gauss(\S,\S,\Ss)}) {$f(x|H_1)$};
    \node[above left, black!20!red ] at ({0.8*\q},{gauss(1.07*\q,\B,\Bs)}) {\strut$\beta$};
    \node[above right,black!20!blue] at ({1.1*\q},{gauss(1.07*\q,\B,\Bs)}) {\strut$\alpha$};

  \end{axis}
\end{tikzpicture}


% GAUSSIANs: p-value
\begin{tikzpicture}

  \def\q{13.8};
  \def\B{8.5};
  \def\S{18.5};
  \def\Bs{2.60};
  \def\Ss{3.40};
  \def\xmax{\S+3.2*\Ss};
  \def\ymin{{-0.15*gauss(\B,\B,\Bs)}};

  \begin{axis}[every axis plot post/.append style={
               mark=none,domain={-0.05*(\xmax)}:{1.08*\xmax},samples=80,smooth},
               xmin={-0.1*(\xmax)}, xmax=\xmax,
               ymin=\ymin, ymax={1.1*gauss(\B,\B,\Bs)},
               axis lines=middle,
               axis line style=thick,
               %axis x line=bottom,  % no box around the plot, only x and y axis
               %axis y line=left,    % ...line*=... suppresses the arrow tips
               enlargelimits=upper, % extend the axes a bit to the right and top
               ticks=none,
               xlabel=$q$,
               every axis x label/.style={at={(current axis.right of origin)},anchor=north west},
              ]

    % plots
    \addplot[blue, name path=B,thick] {gauss(x,\B,\Bs)};
    \addplot[red,  name path=S,thick] {gauss(x,\S,\Ss)};
    \addplot[black,dashed,name path=Q,thick]
      coordinates {(\q, {0.95*gauss(\B,\B,\Bs)}) (\q, \ymin)}
      node[below=2pt,anchor=south west] {$q_\text{obs}$};

    % fill
    \path[name path=xaxis]
      (0,0) -- (\pgfkeysvalueof{/pgfplots/xmax},0); %\pgfkeysvalueof{/pgfplots/xmin}
    \addplot[white!50!blue] fill between[of=xaxis and B, soft clip={domain=\q:\xmax}];
    \addplot[white!50!red]  fill between[of=xaxis and S, soft clip={domain=0:\q}];

    % labels
    \node[above,      black!20!blue]              at (1.12*\B,{gauss(\B,\B,\Bs)}) {background only};
    \node[above right,black!20!red,align=center]  at (1.05*\S,{gauss(\S,\S,\Ss)}) {signal +\\background};
    \node[above left, black!20!red ] at ({0.8*\q},{gauss(1.07*\q,\B,\Bs)}) {\strut$p_\text{s+b}$};
    \node[above right,black!20!blue] at ({1.1*\q},{gauss(1.07*\q,\B,\Bs)}) {\strut$p_\text{b}$};

  \end{axis}
\end{tikzpicture}


\end{document}
latex/tikz/statistics.txt · Last modified: by iwn


