User Tools
latex:tikz:decay_planes
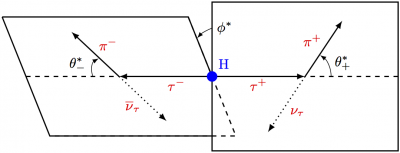
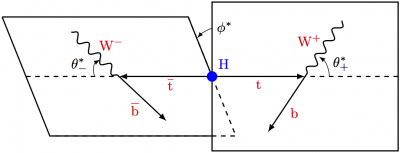
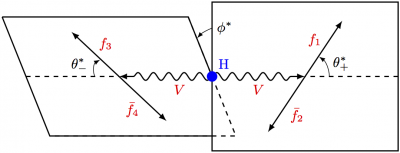
Example of drawing decay planes with LaTeX using the TikZ package. For more, please visit https://tikz.net/category/physics/particle-physics/.
- decay_planes.tex
% Author: Izaak Neutelings (June, 2017)
% model diagram: https://arxiv.org/abs/hep-ph/0503172
% boson/wiggle/snake: https://tex.stackexchange.com/questions/68890/how-can-i-draw-snake-arrow-in-automata-using-tikz

\documentclass{article}
\usepackage{tikz}
\usepackage{tikz-3dplot}
\tikzset{>=latex} % for LaTeX arrow head
\usetikzlibrary{decorations.pathmorphing} % for snake

% split figures into pages
\usepackage[active,tightpage]{preview}
\PreviewEnvironment{tikzpicture}
\setlength\PreviewBorder{1pt}%

\begin{document}


%                         PA________________PB
%  QA________________QB  _|                  |
%   \       F3         \/ |            F1    |
%    \        \         \ |           /      |
%     \      ( \         \|          / )     |
%      \--------\<--------o-------->/--------+
%       \        \        |\       /         |
%        \        \       | \     /          |
%         \        F4     |  \    F2         |
%          QD_____________|_QC               |
%                         PD________________PC
%


% FALSE PERSPECTIVE - Higgs to top quark pair
\small
\tdplotsetmaincoords{90}{90} % look straight at yz plane
\begin{tikzpicture}[tdplot_main_coords,scale=0.85]

  \def\W{5}
  \def\w{2.5}
  \def\R{0.65}

  \coordinate (A)  at (0,-\W, 0);
  \coordinate (O)  at (0,  0, 0);
  \coordinate (B)  at (0, \W, 0);

  \coordinate (P1) at (0,  0,   2);
  \coordinate (P2) at (0, \W,   2);
  \coordinate (P3) at (0, \W,  -2);
  \coordinate (P4) at (0,  0,  -2);
  \coordinate (P0) at (0, \w,   0);
  \coordinate (F1) at (0,3.5, 1.5);
  \coordinate (F2) at (0,1.5,-1.5);

  \coordinate (phi) at (0,0,1.3);

  \begin{scope}[xslant=-0.4,yscale=0.8]
    \coordinate (Q1) at (0, -\W,   2);
    \coordinate (Q2) at (0,   0,   2);
    \coordinate (Q3) at (0,   0,  -2);
    \coordinate (Q4) at (0, -\W,  -2);
    \coordinate (Q0) at (0, -\w,   0);
    \coordinate (F3) at (0,-3.3, 1.5);
    \coordinate (F4) at (0,-1.7,-1.5);
  \end{scope}

  % plane 2
  \draw[thick]
        (Q1) %node at (Q1) {Q1}
     -- (Q2) %node at (Q2) {Q2}
     -- (Q3) %node at (Q3) {Q3}
     -- (Q4) %node at (Q4) {Q4}
     -- (Q1);

  % plane 1 - filled white
  \fill[color=white,thick,draw=black]
        (P1) -- (P2) -- (P3) -- (P4) -- cycle;

  % plane 2 - dashes corner
  \begin{scope}
    \clip (P1) -- (P2) -- (P3) -- (P4) -- cycle;
    \draw[dashed,thick] (Q2) -- (Q3) -- (Q4);
  \end{scope}

  % axis and arrows
  \draw[dashed,thick]
    (A)  -- (Q0);
  \draw[dashed,thick]
    (B)  -- (P0);
  \draw[thick,->]
    (O)  -- node[red,below=-1pt]       {t} (P0);
  \draw[thick,->]
    (O)  -- node[red,below right=-2pt] {$\overline{\textrm{t}}$} (Q0);
  \draw[thick,decorate,decoration={snake}] % ,post length=0mm
    (F1) -- node[red,above left=-2pt]  {W$^+$} (P0);
  \draw[thick,->]
    (P0) -- node[red,below right=-1pt] {b} (F2);
  \draw[thick,decorate,decoration={snake,post length=0mm}]
    (F3) -- node[red,above right=-1pt] {W$^-$} (Q0);
  \draw[thick,->]
    (Q0) -- node[red,below left=-1pt]  {$\overline{\textrm{b}}$} (F4);

  % dots
  \fill[blue] (O) circle [radius=4pt];
    \node [above=8pt,right=1pt,blue] at (O) {H}; % needs extra package
  %\fill (P0) circle [radius=2pt];
  %\fill (Q0) circle [radius=2pt];

  % angles
  \draw[canvas is yz plane at x=0,rotate around z=20,->]
    (phi) arc [start angle=90,end angle=118,radius=1]
    node at (phi) [right=0pt] {$\phi^*$};
  \draw[canvas is yz plane at x=0,->]
    (P0)+(\R,0,0)  arc [start angle=0,end angle=55,radius=\R]
    node[midway,above=1pt,right=1pt] {$\theta^*_+$};
  \draw[canvas is yz plane at x=0,xslant=-0.4,yscale=0.8,->]
    (Q0)+(-\R,0,0) arc [start angle=180,end angle=120,radius=\R]
    node[midway,above=1pt,left=1pt] {$\theta^*_-$};

\end{tikzpicture}


% FALSE PERSPECTIVE - Higgs to top quark pair
\small
\tdplotsetmaincoords{90}{90} % look straight at yz plane
\begin{tikzpicture}[tdplot_main_coords,scale=0.85]

  \def\W{5}
  \def\w{2.5}
  \def\R{0.65}

  \coordinate (A)  at (0,-\W, 0);
  \coordinate (O)  at (0,  0, 0);
  \coordinate (B)  at (0, \W, 0);

  \coordinate (P1) at (0,  0,   2);
  \coordinate (P2) at (0, \W,   2);
  \coordinate (P3) at (0, \W,  -2);
  \coordinate (P4) at (0,  0,  -2);
  \coordinate (P0) at (0, \w,   0);
  \coordinate (F1) at (0,3.5, 1.5);
  \coordinate (F2) at (0,1.5,-1.5);

  \coordinate (phi) at (0,0,1.3);

  \begin{scope}[xslant=-0.4,yscale=0.8]
    \coordinate (Q1) at (0, -\W,   2);
    \coordinate (Q2) at (0,   0,   2);
    \coordinate (Q3) at (0,   0,  -2);
    \coordinate (Q4) at (0, -\W,  -2);
    \coordinate (Q0) at (0, -\w,   0);
    \coordinate (F3) at (0,-3.3, 1.5);
    \coordinate (F4) at (0,-1.7,-1.5);
  \end{scope}

  % plane 2
  \draw[thick]
        (Q1) %node at (Q1) {Q1}
     -- (Q2) %node at (Q2) {Q2}
     -- (Q3) %node at (Q3) {Q3}
     -- (Q4) %node at (Q4) {Q4}
     -- (Q1);

  % plane 1 - filled white
  \fill[color=white,thick,draw=black]
        (P1) -- (P2) -- (P3) -- (P4) -- cycle;

  % plane 2 - dashes corner
  \begin{scope}
    \clip (P1) -- (P2) -- (P3) -- (P4) -- cycle;
    \draw[dashed,thick] (Q2) -- (Q3) -- (Q4);
  \end{scope}

  % axis and arrows
  \draw[dashed,thick]
    (A)  -- (Q0);
  \draw[dashed,thick]
    (B)  -- (P0);
  \draw[thick,->,decorate,decoration={snake,post length=5}]
    (O)  -- node[red,below=2pt]       {$V$} (P0);
  \draw[thick,->,decorate,decoration={snake,post length=5}]
    (O)  -- node[red,below right=2pt] {$V$} (Q0);
  \draw[thick,->] % ,post length=0mm
    (P0) -- node[red,above left=-2pt]  {$f_1$} (F1);
  \draw[thick,->]
    (P0) -- node[red,below right=-1pt] {$\bar{f_2}$} (F2);
  \draw[thick,->]
    (Q0) -- node[red,above right=-1pt] {$f_3$} (F3);
  \draw[thick,->]
    (Q0) -- node[red,below left=-1pt]  {$\bar{f_4}$} (F4);

  % dots
  \fill[blue] (O) circle [radius=4pt];
    \node [above=8pt,right=1pt,blue] at (O) {H}; % needs extra package
  %\fill (P0) circle [radius=2pt];
  %\fill (Q0) circle [radius=2pt];

  % angles
  \draw[canvas is yz plane at x=0,rotate around z=20,->]
    (phi) arc [start angle=90,end angle=118,radius=1]
    node at (phi) [right=0pt] {$\phi^*$};
  \draw[canvas is yz plane at x=0,->]
    (P0)+(\R,0,0)  arc [start angle=0,end angle=55,radius=\R]
    node[midway,above=1pt,right=1pt] {$\theta^*_+$};
  \draw[canvas is yz plane at x=0,xslant=-0.4,yscale=0.8,->]
    (Q0)+(-\R,0,0) arc [start angle=180,end angle=120,radius=\R]
    node[midway,above=1pt,left=1pt] {$\theta^*_-$};

\end{tikzpicture}


\end{document}
latex/tikz/decay_planes.txt · Last modified: by iwn


