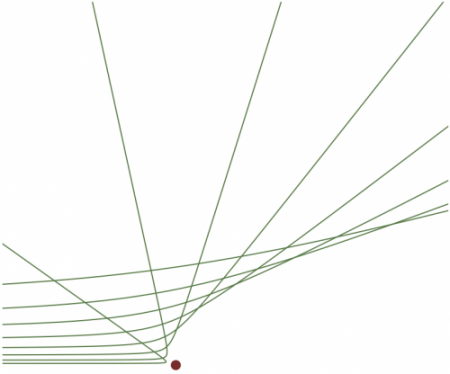
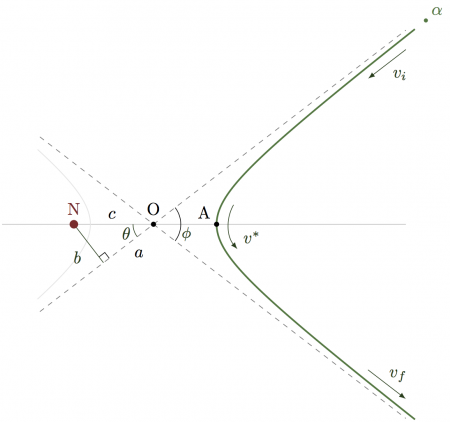
Example of adding and projecting vectors. For more related figures, please visit https://tikz.net/category/physics/particle-physics/.
- hyperbola.tex
% Author: Izaak Neutelings (July, 2017)

\documentclass{article}
\usepackage{amsmath} % for \dfrac
\usepackage{tikz}
\tikzset{>=latex} % for LaTeX arrow head
\usepackage{pgfplots} % for the axis environment
\usetikzlibrary{calc} % to do arithmetic with coordinates
\usetikzlibrary{angles,quotes} % for pic

% colors
\definecolor{mylightgrey}{RGB}{230,230,230}
\definecolor{mygrey}{RGB}{190,190,190}
\definecolor{mydarkgrey}{RGB}{110,110,110}
\definecolor{mygreen}{RGB}{120,220,160}
\definecolor{mydarkgreen}{RGB}{60,120,60}
\definecolor{myverydarkgreen}{RGB}{20,60,20}
\definecolor{mydarkred}{RGB}{140,40,40}

% mark right angle
\newcommand{\MarkRightAngle}[4][1.5mm]
{\coordinate (tempa) at ($(#3)!#1!(#2)$);
 \coordinate (tempb) at ($(#3)!#1!(#4)$);
 \coordinate (tempc) at ($(tempa)!0.5!(tempb)$);%midpoint
 \draw (tempa) -- ($(#3)!2!(tempc)$) -- (tempb);
}

% split figures into pages
\usepackage[active,tightpage]{preview}
\PreviewEnvironment{tikzpicture}
\setlength\PreviewBorder{1pt}%

\begin{document}


% RUTHERFORD SCATTERING - hyperbola orbit
\begin{tikzpicture}[scale=1]

  % limits & parameters
  \def\xa{-2.4}
  \def\xb{ 4}
  \def\ya{-4}
  \def\yb{ 4}
  \def\tmax{2.1}
  \def\a{1.3}
  \def\b{1}
  \def\c{{sqrt(\a^2+\b^2)}}
  \def\N{100} % number of points

  % coordinates
  \coordinate (O)  at (   0,  0 );
  \coordinate (A)  at (  \a,  0 );
  \coordinate (F1) at (  {sqrt(\a^2+\b^2)},   0 );
  \coordinate (F2) at ( -{sqrt(\a^2+\b^2)},   0 );
  \coordinate (P)  at ( -{\a^2/sqrt(\a^2+\b^2)}, -{\a*\b/sqrt(\a^2+\b^2)} );
  \coordinate (P1) at (\xb*\a, \yb*\b);
  \coordinate (P2) at (\xb*\a,-\yb*\b);
  \coordinate (yshift) at (0,0.4);

  % axes & asymptotes
  \draw[mygrey] % x axis
    (\xa*\a,0) -- (\xb*\a,0);
  \draw[dashed,mydarkgrey]
    (-\xb*\a*0.45, \ya*\b*0.45) -- (\xb*\a, \yb*\b)
    (-\xb*\a*0.45,-\ya*\b*0.45) -- (\xb*\a,-\yb*\b);

  % arrows
  \def\vtheta{30}
  \def\vradius{0.8}
  \draw[->,myverydarkgreen,shift=($(P1)-(yshift)$),scale=0.6]
	(0,0) -- (-\a,-\b) node[midway,below right=0pt] {${v}_i$};
  \draw[->,myverydarkgreen,shift=($(P2)+(yshift)$),scale=0.6]
	(-\a,\b) -- (0,0) node[midway,above right=-2pt] {${v}_f$};
  \draw[->,myverydarkgreen]
    (\a+0.35,{\vradius*sin(\vtheta)}) arc (180-\vtheta:180+\vtheta+10:\vradius)
    node[above right=0pt] {$v^*$};

  % angles
  \MarkRightAngle{F2}{P}{O}
  \pic [draw,myverydarkgreen,"$\theta$",angle radius=12,angle eccentricity=1.4] {angle = F2--O--P};
  \pic [draw,below,angle radius=16,angle eccentricity=1.4] {angle = P2--O--P1};
  \node[right=1pt,below=-2pt,myverydarkgreen] at ($(O)!0.5!(A)$)  {\small$\phi$};

  % hyperbola
  \draw[color=mylightgrey,line width=0.5,samples=\N,variable=\t,domain=-\tmax*0.58:\tmax*0.58] % left
    plot({-\a*cosh(\t)},{\b*sinh(\t)});
  \draw[color=mydarkgreen,line width=1,samples=\N,variable=\t,domain=-\tmax:\tmax] % right
    plot({ \a*cosh(\t)},{\b*sinh(\t)}); % {exp(\y)+exp(-\y)

  % nodes
  \draw[myverydarkgreen]
    (F2) -- (P) node[midway,below left=1pt,] {$b$};
  \fill[radius=1.5pt]
    (A)  circle node[above left=0pt] {A}
    (O)  circle node[above=2pt] {O};
  \fill[radius=2.5pt,mydarkred]
    (F2) circle node[above=2pt] {N};
  \draw[]
    %(O) -- (F2)
    node[left=1pt,above=0pt] at ($(F2)!0.5!(O)$) {$c$}
    node[below right] at ($(P)!0.5!(O)$)  {$a$};

  % alpha particle
  \draw[radius=1pt,mydarkgreen,fill]
    ({ \a*cosh(\tmax*1.02)},{\b*sinh(\tmax*1.02)}) circle node[above right=0pt] {$\alpha$};

\end{tikzpicture}


% RUTHERFORD SCATTERING - hyperbolic orbits with different impact parameters
\begin{tikzpicture}[scale=1]

  % limits & parameters
  \def\xa{-35}
  \def\xb{ 55}
  \def\ya{ -1}
  \def\yb{ 55}
  \def\tmax{4.5}
  \def\N{50} % number of points

  % use axes to get square box which cuts of the long curves
  \begin{axis}[ xmin=\xa,xmax=\xb,
                ymin=\ya,ymax=\yb,
                hide x axis, hide y axis,
                xticklabels={,,},yticklabels={,,}
                axis line style={draw=none}, tick style={draw=none}
              ]

    % loop over multiples \u of impact parameters \b=\u*0.25
    \def\a{1}
    \foreach \u in {1,3,6,10,15,21,28,38}{
      \def\b{\u*0.25}
      \def\c{sqrt(\a^2+\b^2)}
      % hyperbola
      \addplot[color=mydarkgreen,line width=0.5,samples=\N,smooth,variable=\t,domain=-\tmax:\tmax]
         ({   \a/\c*(-\a*cosh(\t)-\c) + \b/\c*\b*sinh(\t)  },
          {  -\b/\c*(-\a*cosh(\t)-\c) + \a/\c*\b*sinh(\t)  });
    }

    % nucleus
    \addplot[mydarkred,mark=*,mark size=2pt,mark options=solid] coordinates {(0,0)};

  \end{axis}

\end{tikzpicture}


\end{document}

