root:showcuts
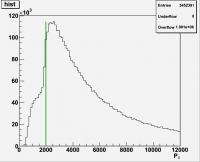
Show cut value as a line in a histogram
 To create a line in a histogram for example to indicate a cut do the following in your python root macro and in the canvas where you have the histogram:
cutObj = TLine(XcutValue, hist.GetMinimum(), XcutValue, hist.GetMaximum())
cutObj.SetLineColor(kGreen+2)
cutObj.SetLineWidth(2)

cutObj.Draw("lsames")
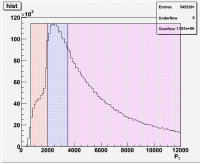
Highlight an area in a histogram
root/showcuts.txt · Last modified: 2010/01/12 11:26 by abuechle


