root:padlayouts
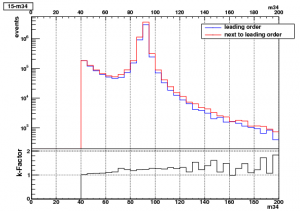
Examples of special padLayouts
Two Histograms next to each other (vertically)
        TCanvas *canvas = new TCanvas("canvas","canvas");
        pad1 = new TPad("pad1","",0,0.3,1,1);
        pad2 = new TPad("pad2","",0,0,1,0.3);
        pad1->Draw();
        pad2->Draw();


        pad1->cd();
        pad1->SetBottomMargin(0.0);
        pad1->SetLogy();
        pad1->SetGridx();
        hist1->SetXTitle(xTitle);
        hist1->GetYaxis()->SetTitleSize(.05);
        hist1->GetYaxis()->SetTitleOffset(.6);
        hist1->GetYaxis()->SetTitle("events");
        hist1->Draw("X+");

        TLegend *legend = new TLegend(0.65,0.85,0.95,0.75);
        legend->AddEntry(hist1, "histogram 1");
        legend->SetFillColor(kWhite);
        legend->Draw();


        pad2->cd();
        pad2->SetTopMargin(0.0);
        pad2->SetBottomMargin(0.2);
        pad2->SetGridx();
        pad2->SetGridy();
        hist2->GetYaxis()->SetNdivisions(503);
        hist2->GetYaxis()->SetLabelSize(.1);
        hist2->GetYaxis()->SetRangeUser(0,2.1);
        hist2->GetYaxis()->SetTitleSize(.12);
        hist2->GetYaxis()->SetTitleOffset(.2);
        hist2->GetYaxis()->SetTitle("k-Factors");
        hist2->GetXaxis()->SetLabelSize(.1);
        hist2->GetXaxis()->SetTitleOffset(.8);
        hist2->GetXaxis()->SetTitleSize(.1);
        hist2->GetXaxis()->SetTitle(xTitle);
        hist2->Draw();
root/padlayouts.txt · Last modified: 2010/11/09 16:59 by nchiap


