\documentclass[border=3pt,tikz]{standalone}
\usepackage{amsmath,amssymb}
\usepackage{bm} % math bold
\usepackage[outline]{contour} % glow around text
\contourlength{1.2pt}

\usepackage{tikz}
\usetikzlibrary{patterns}
\tikzset{>=latex}
\usetikzlibrary{calc}
\usetikzlibrary{angles,quotes} % for pic

\begin{document}

\begin{tikzpicture}[scale=0.5]
  \def\N{20}
  \def\vi{14}
  \def\g{10}
  \def\thetaI{30}
  \def\D{\vi^2*sin(2*\thetaI)/\g} %15
  \def\ymax{\vi^2*sin(\thetaI)^2/(2*\g)*1.4}
  \def\xmax{\D*1.1}
  \def\xmin{-1}
  \def\ymin{-1}
  \def\tmin{-0.02}
  \def\tmax{(2*\vi*sin(\thetaI)/\g)+0.05}

  % water, beach & rock
  \fill[blue!40!cyan!40!white!40]
    (0,0) rectangle ({(\xmax+\D)/2},\ymin*0.8);
  \draw[very thin,fill=yellow] %north east lines, crosshatch dots
    (\xmin*2.4,\ymin*0.8) to[out=60,in=180] (0,0) to[out=0,in=120] (-\xmin*0.9,\ymin*0.8);
  \draw[very thin,fill=black!50!white] %north east lines, crosshatch dots
    ({\D},-0.2) circle (0.2);

  % axes
  \draw[thick,->] (\xmin,0) -- ({\xmax},0) node[right=8pt,anchor=north] {$x\,[\text{m}]$};
  \draw[thick,->] (0,\ymin) -- (0,{\ymax}) node[anchor=east] {$y\,[\text{m}]$};
  \draw[thick] ({\D},-0.2) -- ({\D},0.2) node[right=1pt,above] {$D$};

  % parabola
  \draw[very thick,black!40!blue,variable=\t,domain=\tmin:\tmax,samples=\N,smooth]
    plot ({\vi*cos(\thetaI)*\t},{\vi*sin(\thetaI)*\t-\g*\t^2/2});

  % vectors
  \coordinate (O)   at (0,0);
  \coordinate (X)   at (1,0);
  \coordinate (V)   at ({\vi*cos(\thetaI)/3},{\vi*sin(\thetaI)/3});
  \coordinate (Vx)  at ({\vi*cos(\thetaI)/3},-0.1);
  \coordinate (Vy)  at (-0.1,{\vi*sin(\thetaI)/3});
%  \draw[dashed,black!10!red]
%    (V) -- (Vx)
%    node[below=-2pt] {\contour{white}{$v_0\cos\theta$}};
%  \draw[dashed,black!10!red]
%    (V) -- (Vy)
%    node[left] {$v_0\sin\theta$};
  \draw[->,black!30!red,thick]
    (O) -- (V)
    node[above right] {\contour{white}{$\bm{v_0}$}}; %=(v_0\cos\theta,v_0\sin\theta)

  % angles
  \pic[draw,thick,black!50!red,"\footnotesize$\theta$",angle radius=30,angle eccentricity=1.2]
    {angle = X--O--V};

\end{tikzpicture}

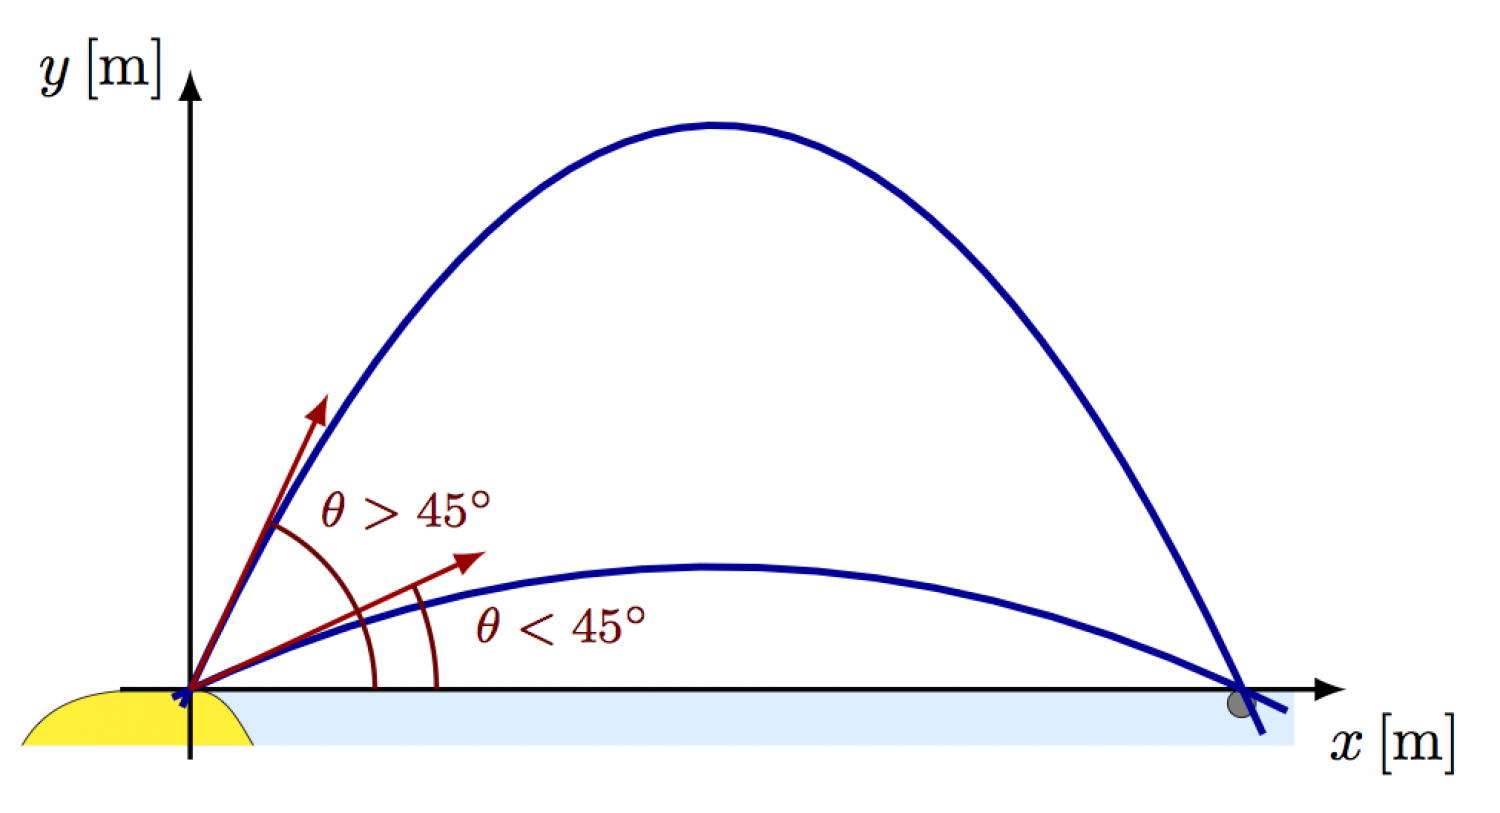
\begin{tikzpicture}[scale=0.4]
  \def\N{20}
  \def\vi{14}
  \def\D{15}
  \def\g{10}
  \def\thetaI{65}
  \def\thetaII{25}
  \def\ymax{{\vi^2*sin(\thetaI)^2/(2*\g)*1.1}}
  \def\xmax{\D*1.1}
  \def\xmin{-1}
  \def\ymin{-1}
  \def\tmin{-0.02}
  \def\tmaxI{(2*\vi*sin(\thetaI)/\g)+0.05}
  \def\tmaxII{(2*\vi*sin(\thetaII)/\g)+0.05}

  % water, beach & rock
  \fill[blue!40!cyan!40!white!40]
    (0,0) rectangle ({(\xmax+\D)/2},\ymin*0.8);
  \draw[very thin,fill=yellow] %north east lines, crosshatch dots
    (\xmin*2.4,\ymin*0.8) to[out=60,in=180] (0,0) to[out=0,in=120] (-\xmin*0.9,\ymin*0.8);
  \draw[very thin,fill=black!50!white] %north east lines, crosshatch dots
    (\D,-0.2) circle (0.2);

  % axes
  \draw[thick,->] (\xmin,0) -- (\xmax,0) node[right=8pt,anchor=north] {$x\,[\text{m}]$};
  \draw[thick,->] (0,\ymin) -- (0,\ymax) node[anchor=east] {$y\,[\text{m}]$};

  % parabola
  \draw[very thick,black!40!blue,variable=\t,domain=\tmin:\tmaxI,samples=\N*2]
    plot ({\vi*cos(\thetaI)*\t},{\vi*sin(\thetaI)*\t-\g*\t^2/2});
  \draw[very thick,black!40!blue,variable=\t,domain=\tmin:\tmaxII,samples=\N]
    plot ({\vi*cos(\thetaII)*\t},{\vi*sin(\thetaII)*\t-\g*\t^2/2});

  % vectors
  \coordinate (O)   at (0,0);
  \coordinate (X)   at (1,0);
  \coordinate (V)   at ({\vi*cos(\thetaII)/3},{\vi*sin(\thetaII)/3});
  \coordinate (V')  at ({\vi*cos(\thetaI)/3}, {\vi*sin(\thetaI)/3});
  \coordinate (Vx)  at ({\vi*cos(\thetaII)/3},0);
  \coordinate (Vx') at ({\vi*cos(\thetaI)/3}, 0);
  \draw[->,black!30!red,thick] (O) -- (V);
  \draw[->,black!30!red,thick] (O) -- (V');

  % projections
  %\draw[dashed,black!20!red] (Vx)  -- (V);
  %\draw[dashed,black!20!red] (Vx') -- (V');

  % angles
  \pic[draw,thick,black!50!red,angle radius=40,angle eccentricity=1.2]
    {angle = X--O--V};
  \pic[black!50!red,"\footnotesize$\theta<45^\circ$" right=-4pt,
       angle radius=40,angle eccentricity=1.2]
    {angle = X--O--V};
  \pic[draw,thick,black!50!red,angle radius=30,angle eccentricity=1.2]
    {angle = X--O--V'};
  \pic[black!50!red,"\footnotesize$\theta>45^\circ$" above,
       angle radius=35,angle eccentricity=1.2]
    {angle = X--O--V'};
\end{tikzpicture}

\end{document}

